Grafana
GreptimeDB can be configured as a Grafana data source. You have the option to connect GreptimeDB with Grafana using one of three data sources: GreptimeDB, Prometheus, or MySQL.
GreptimeDB data source plugin
The GreptimeDB data source plugin is based on the ClickHouse data source and adds GreptimeDB-specific features. The plugin adapts perfectly to the GreptimeDB data model, thus providing a better user experience. In addition, it also solves some compatibility issues compared to using the Prometheus data source directly.
Installation
The plugin is not published in the Grafana plugin catalog, so install the unsigned archive and
allow it explicitly in grafana.ini:
[plugins]
allow_loading_unsigned_plugins = info8fcc-greptimedb-datasource
GF_PLUGINS_ALLOW_LOADING_UNSIGNED_PLUGINS is the equivalent environment variable. Grafana Cloud
does not accept unsigned plugins, so use a self-hosted Grafana. If you need a signed build bound to
your own Grafana root_url, contact us.
Make sure Grafana is installed and running before installing the plugin.
You can choose one of the following installation methods:
- Download
info8fcc-greptimedb-datasource-unsigned.zipfrom the release page and unzip it to your grafana plugin directory. - Use grafana cli to download and install:
grafana cli --pluginUrl https://github.com/GreptimeTeam/greptimedb-grafana-datasource/releases/latest/download/info8fcc-greptimedb-datasource-unsigned.zip plugins install info8fcc - Use our prebuilt Grafana docker
image, which ships the
plugin by default:
docker run -p 3000:3000 greptime/grafana-greptimedb:latest
Note that you may need to restart your grafana server after installing the plugin.
Connection settings
Click the Add data source button and select GreptimeDB as the type.
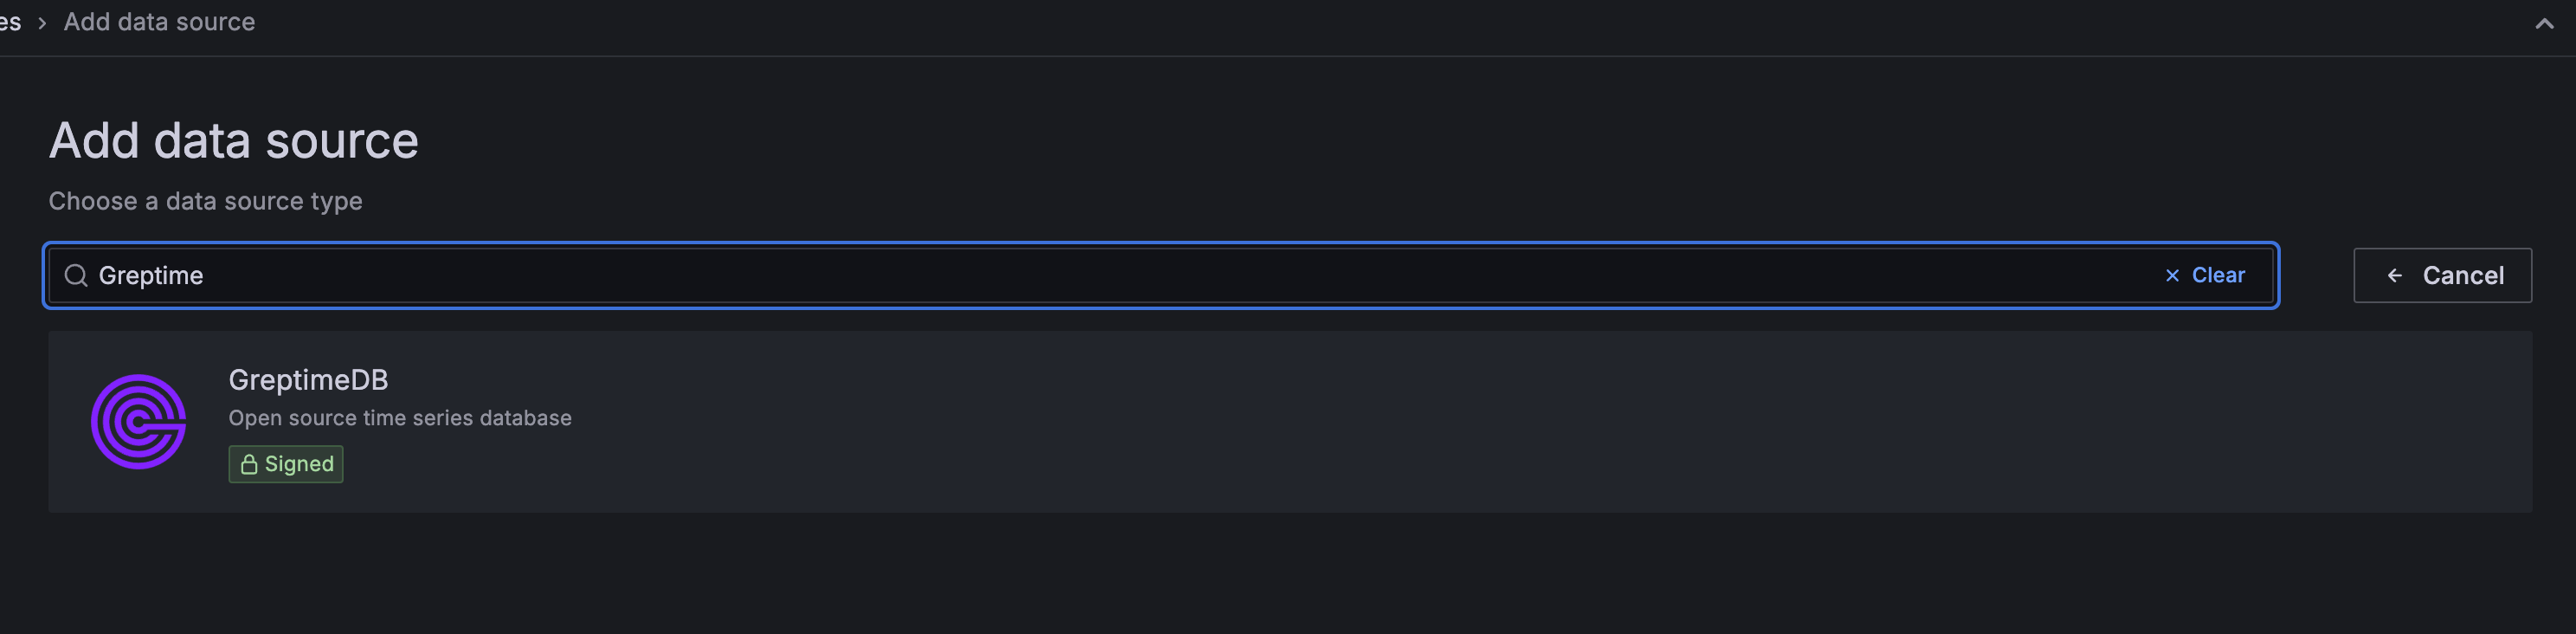
Fill in the following URL in the GreptimeDB server URL:
http://<host>:4000
In the Auth section, click basic auth, and fill in the username and password for GreptimeDB in the Basic Auth Details section (not set by default, no need to fill in).
- User:
<username> - Password:
<password>
Then click the Save & Test button to test the connection.
General Query Settings
Before selecting any query type, you first need to configure the Database and Table to query from.
| Setting | Description |
|---|---|
| Database | Select the database you want to query. |
| Table | Select the table you want to query from. |

Table Query
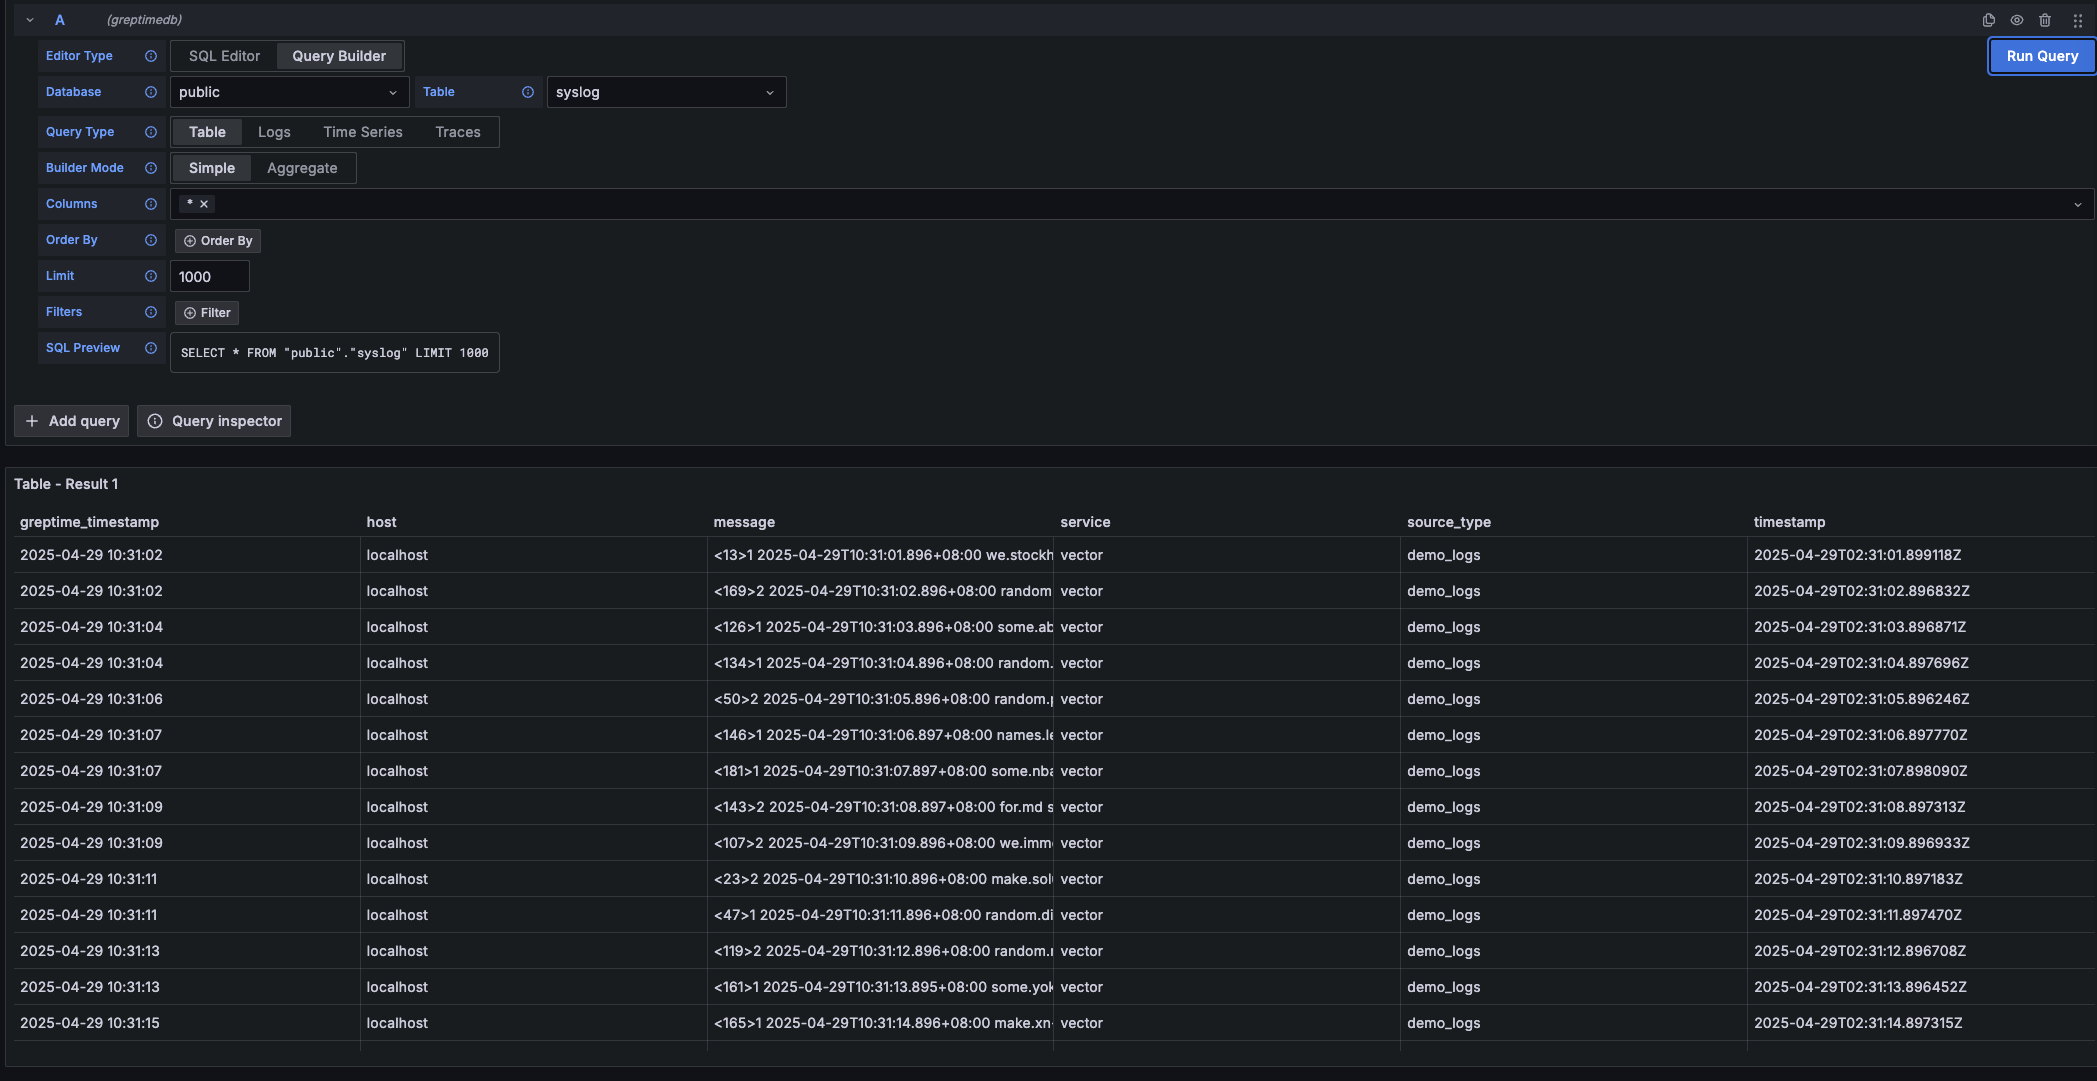
Choose the Table query type when your query results do not include a time column. This is suitable for displaying tabular data.
| Setting | Description |
|---|---|
| Columns | Select the columns you want to retrieve. Multiple selections are allowed. |
| Filters | Set conditions to filter your data. |
Metrics Query
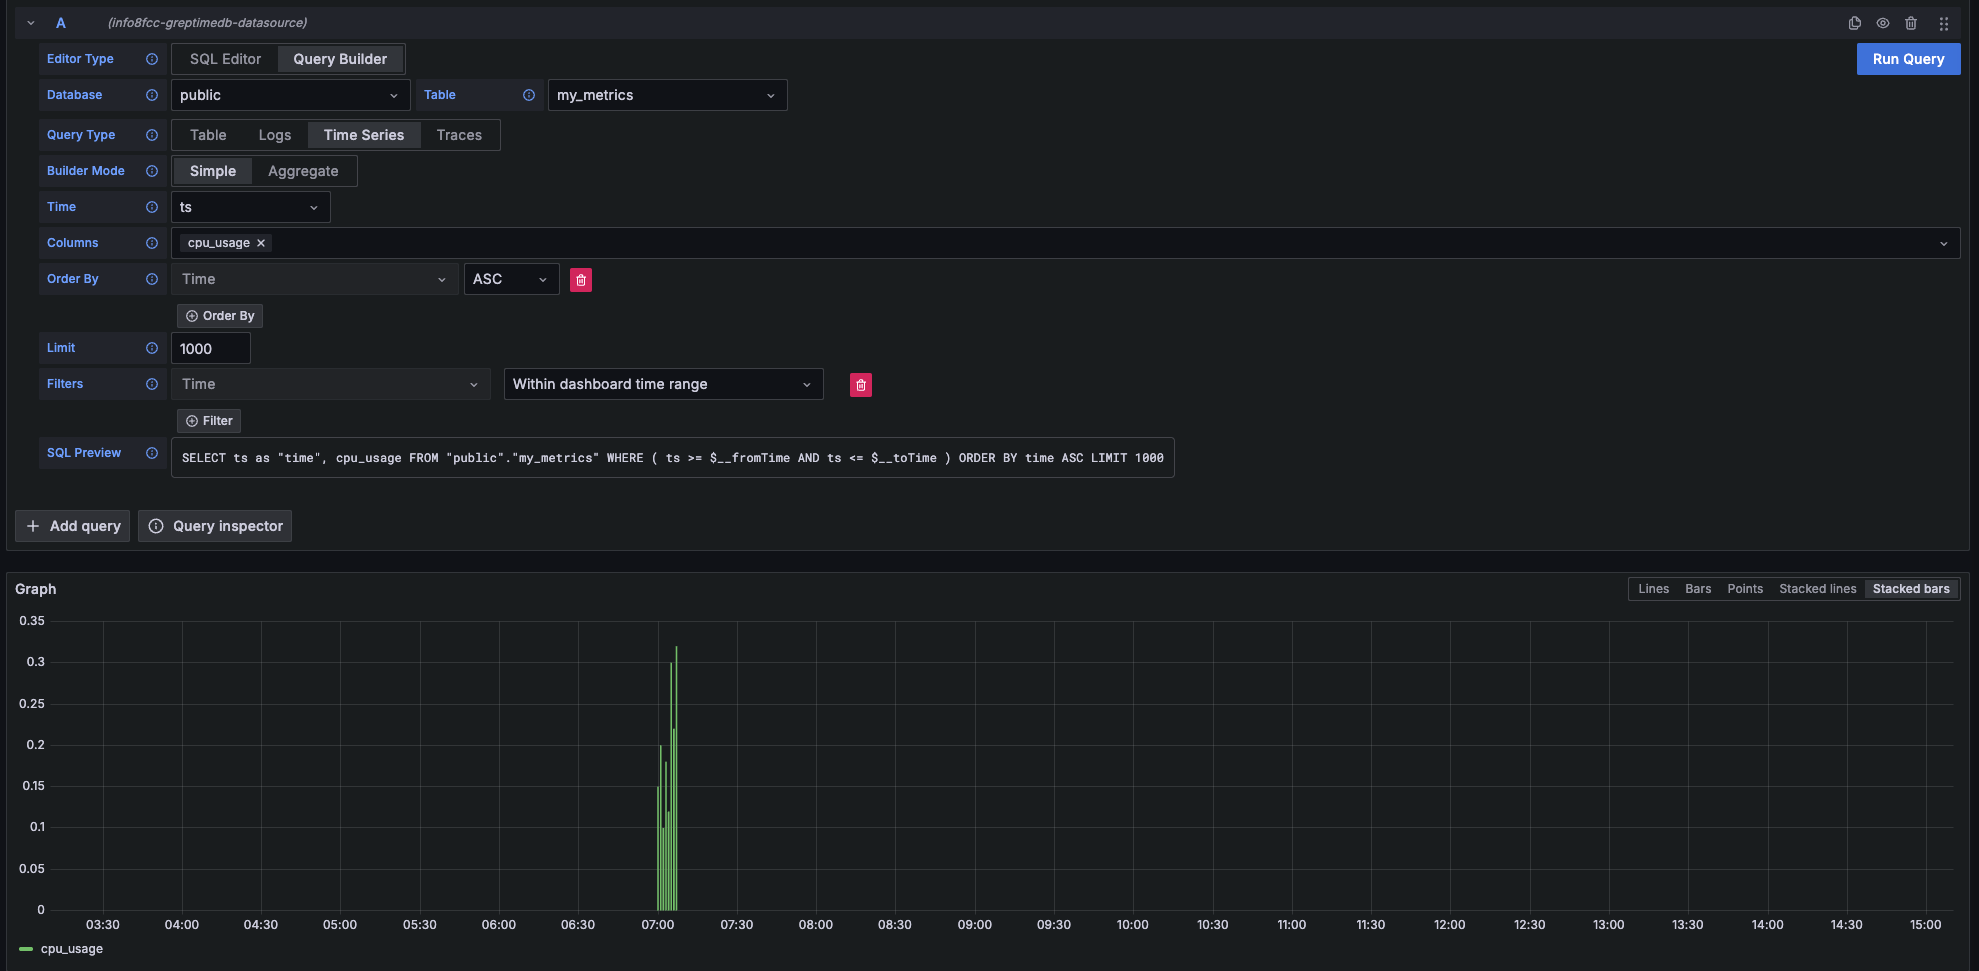
Select the Time Series query type when your query results include both a time column and a numerical value column. This is ideal for visualizing metrics over time.
| Main Setting | Description |
|---|---|
| Time | Select the time column. |
| Columns | Select the numerical value column(s). |
Logs Query
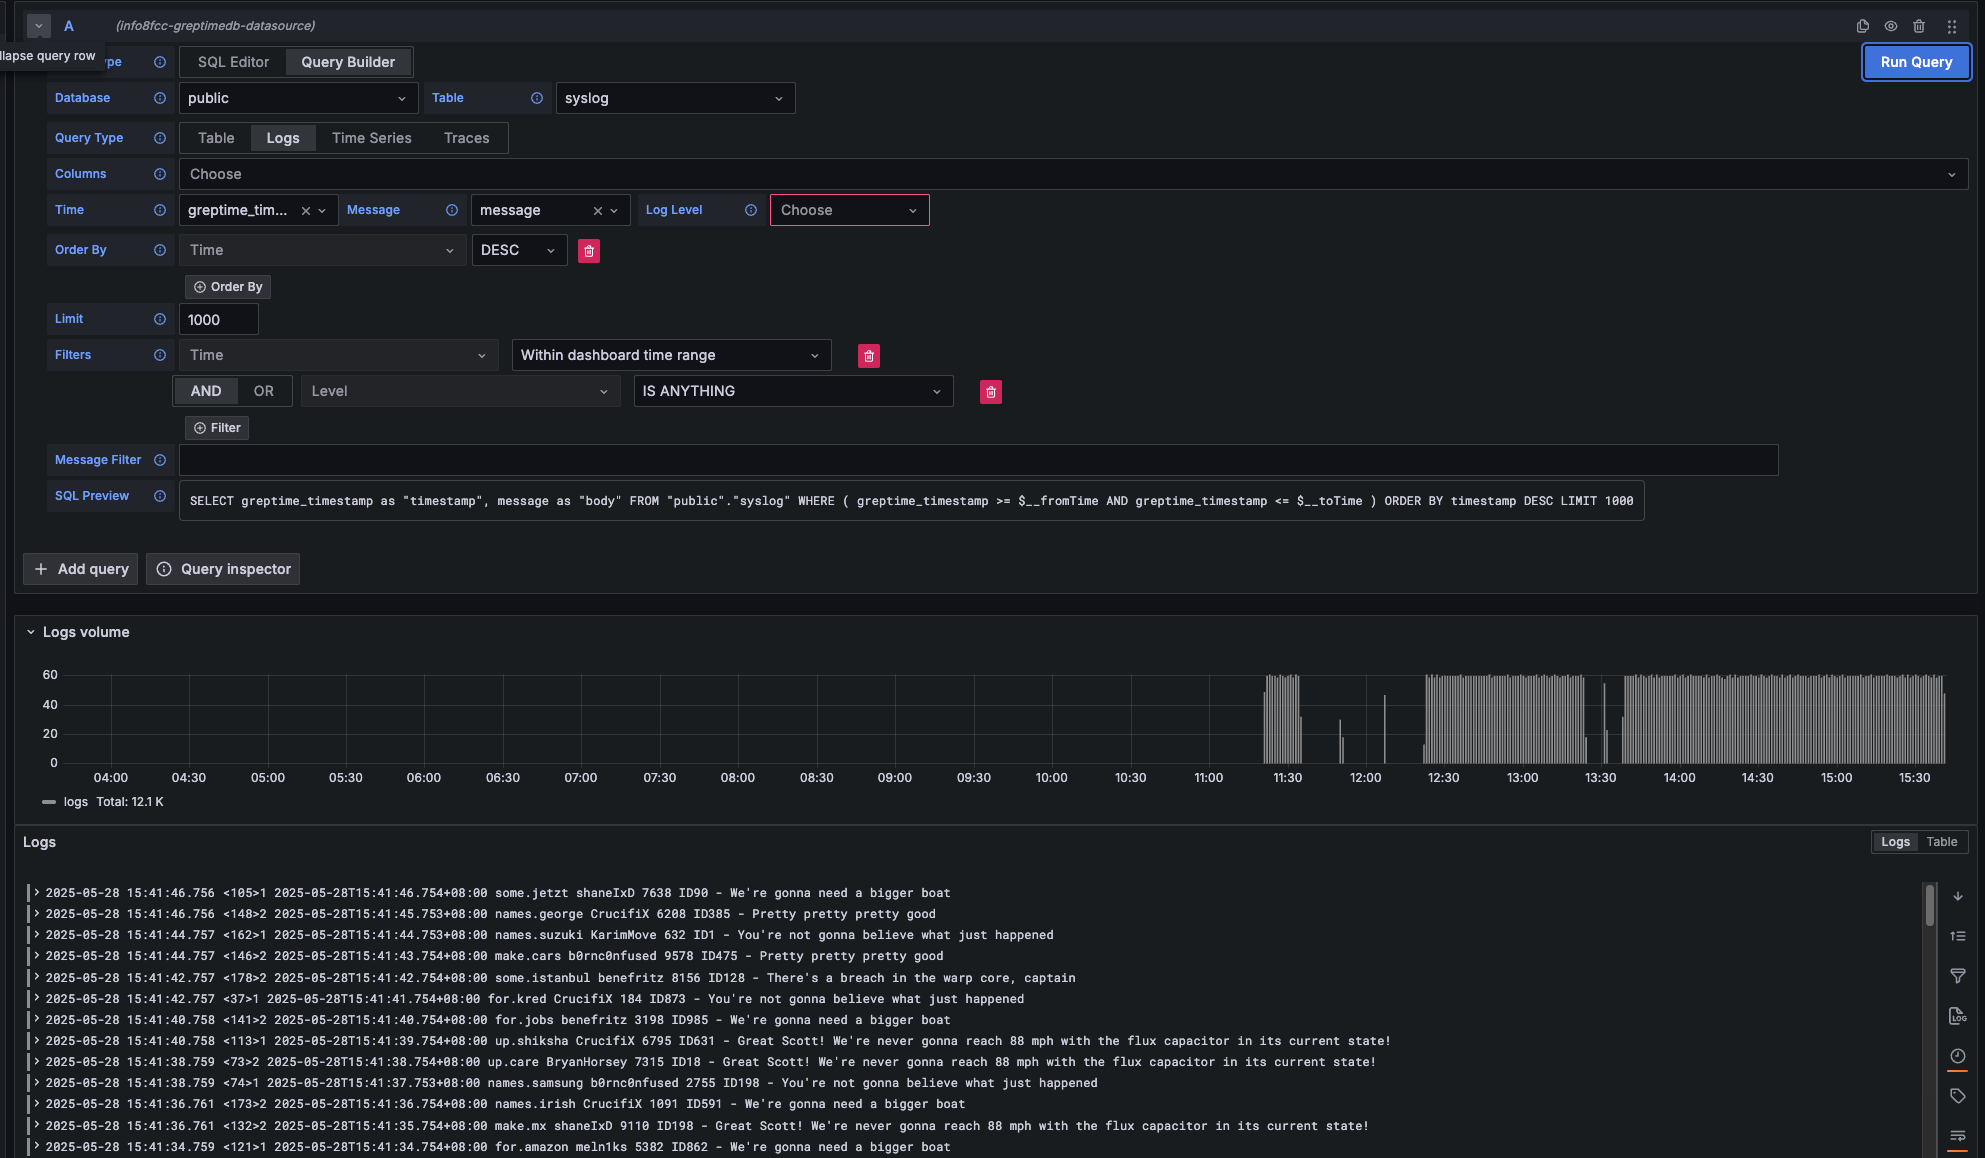
Choose the Logs query type when you want to query log data. You'll need to specify a Time column and a Message column.
| Main Setting | Description |
|---|---|
| Time | Select the timestamp column for your logs. |
| Message | Select the column containing the log content. |
| Log Level | (Optional) Select the column representing the log level. |
logs Context Query
Logs Context Query Performs an approximate time range query based on the value of context columns in a log row.
- First, set the context column in Connection Page.
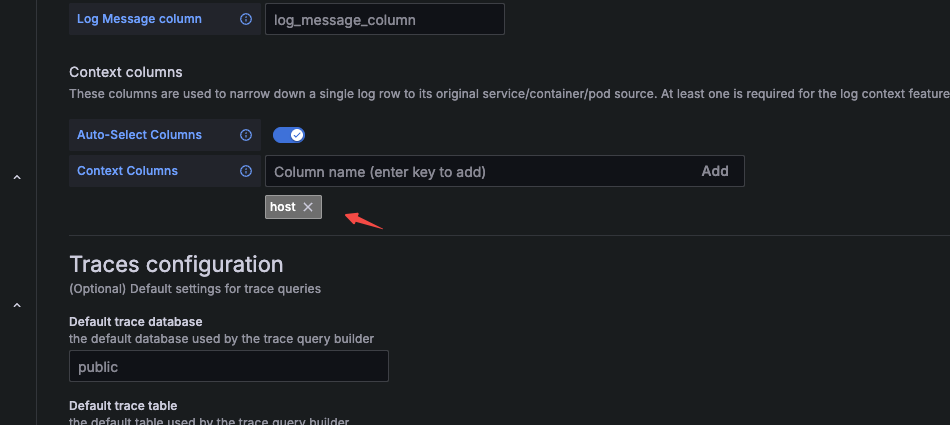
- Then, when making a query, include the context column in the query.
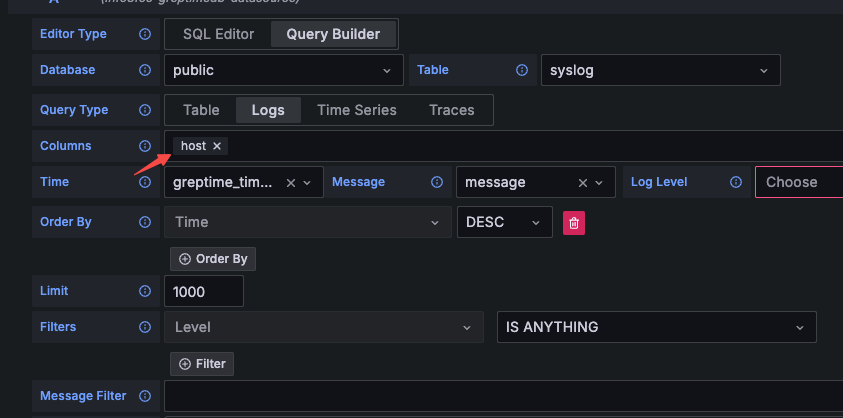
Traces Query
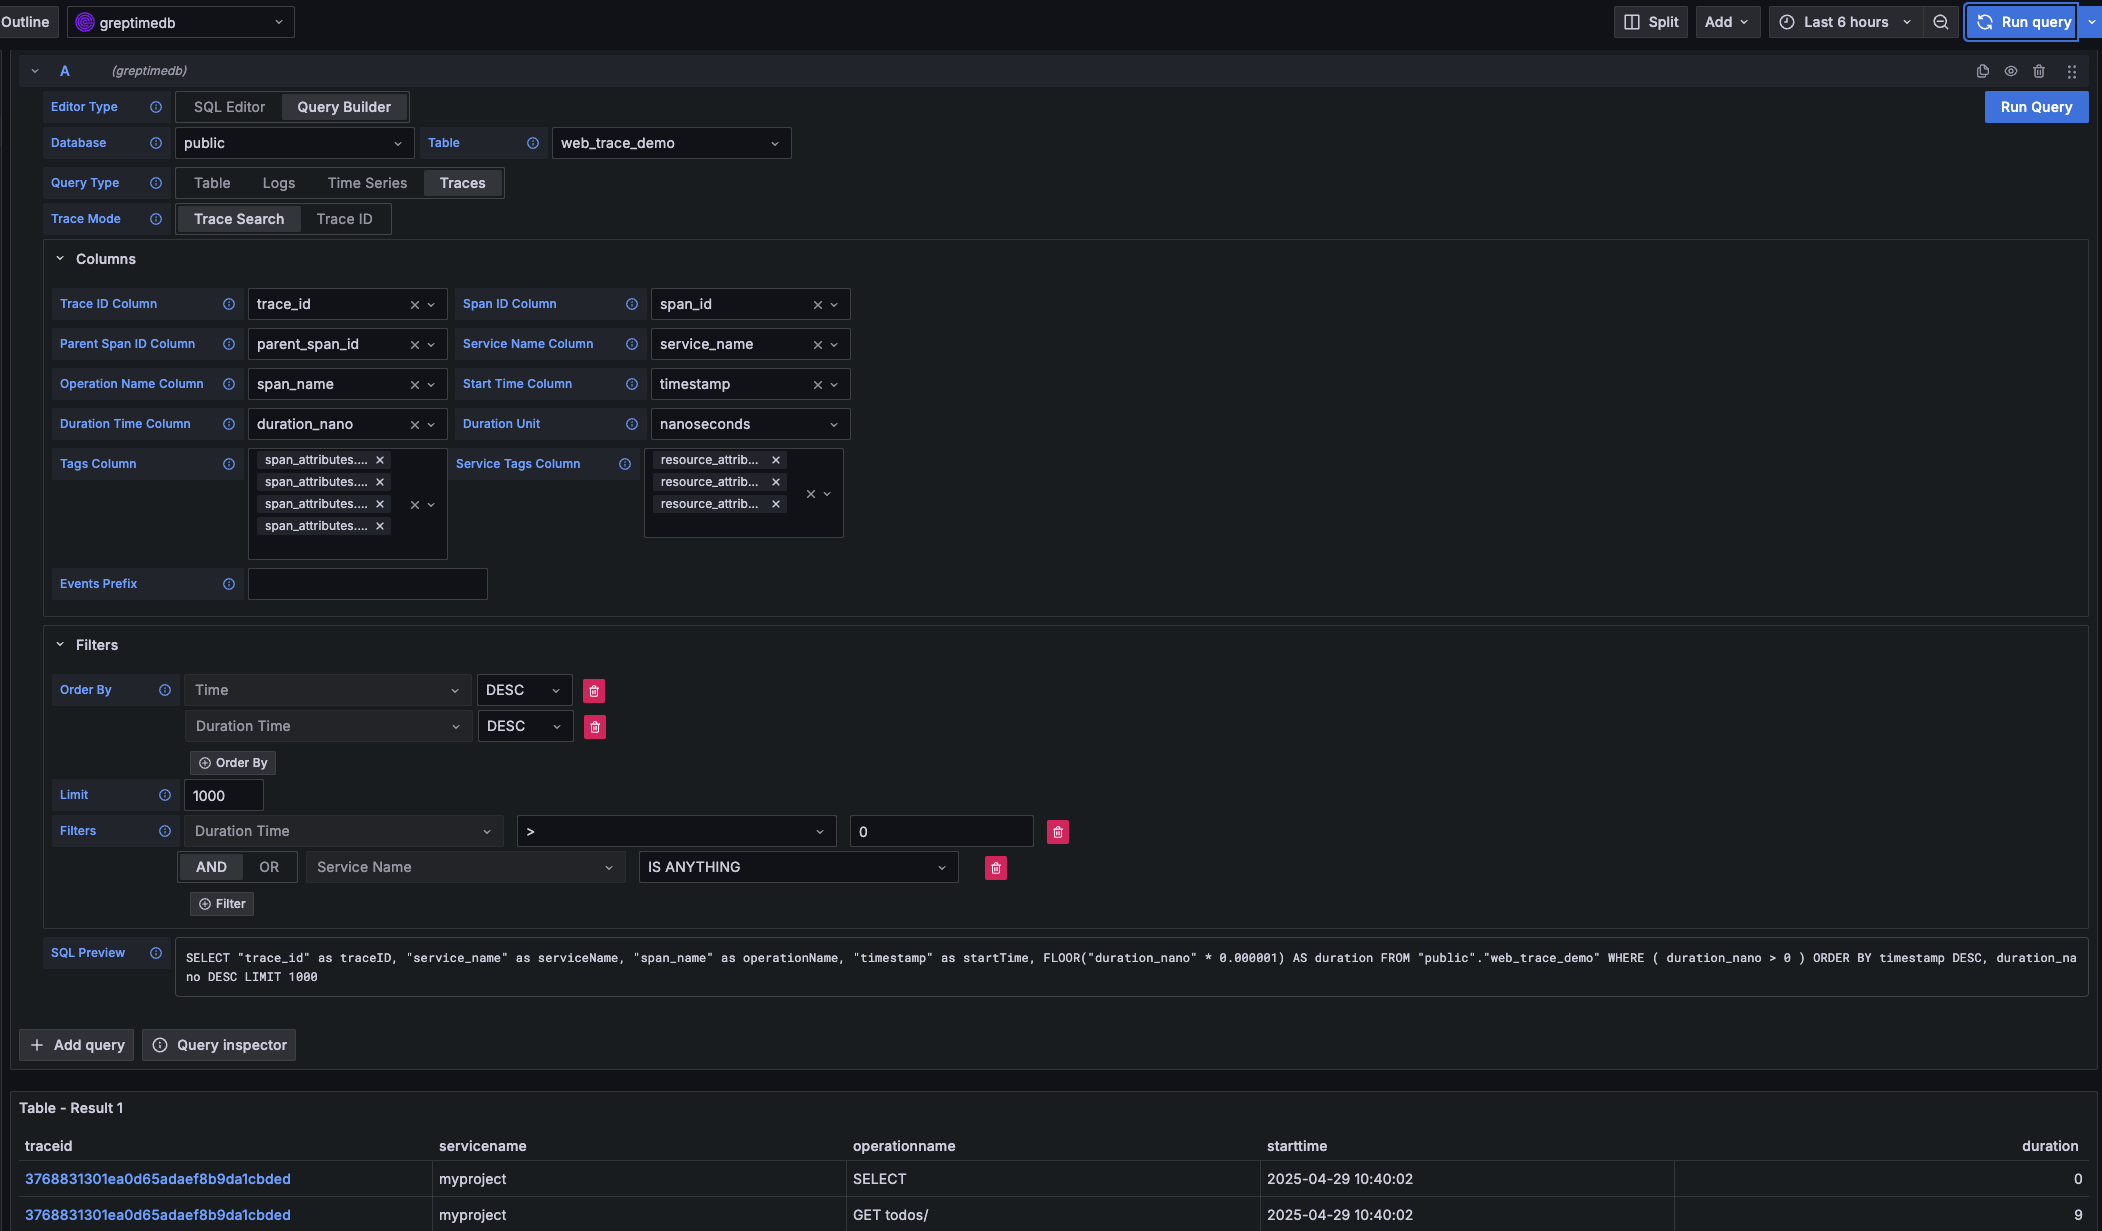
Select the Traces query type when you want to query distributed tracing data.
| Main Setting | Description |
|---|---|
| Trace Model | Select Trace Search to query a list of traces. |
| Trace Id Column | Default value: trace_id |
| Span Id Column | Default value: span_id |
| Parent Span ID Column | Default value: parent_span_id |
| Service Name Column | Default value: service_name |
| Operation Name Column | Default value: span_name |
| Start Time Column | Default value: timestamp |
| Duration Time Column | Default value: duration_nano |
| Duration Unit | Default value: nanoseconds |
| Tags Column | Multiple selections allowed. Corresponds to columns starting with span_attributes (e.g., span_attributes.http.method). |
| Service Tags Column | Multiple selections allowed. Corresponds to columns starting with resource_attributes (e.g., resource_attributes.host.name). |
Prometheus data source
Click the "Add data source" button and select Prometheus as the type.
Fill in Prometheus server URL in HTTP:
http://<host>:4000/v1/prometheus
Click basic auth in the Auth section and fill in your GreptimeDB username and password in Basic Auth Details:
- User:
<username> - Password:
<password>
Click Custom HTTP Headers and add one header:
- Header:
x-greptime-db-name - Value:
<dbname>
Then click "Save & Test" button to test the connection.
For how to query data with PromQL, please refer to the Prometheus Query Language document.
MySQL data source
Click the "Add data source" button and select MySQL as the type. Fill in the following information in MySQL Connection:
- Host:
<host>:4002 - Database:
<dbname> - User:
<username> - Password:
<password> - Session timezone:
UTC
Then click "Save & Test" button to test the connection.
Note that you need to use raw SQL editor for panel creation. SQL Builder is not supported due to timestamp data type difference between GreptimeDB and vanilla MySQL.
For how to query data with SQL, please refer to the Query Data with SQL document.